SP500 LDN TRADING UPDATE 28/11/25

SP500 LDN TRADING UPDATE 28/11/25
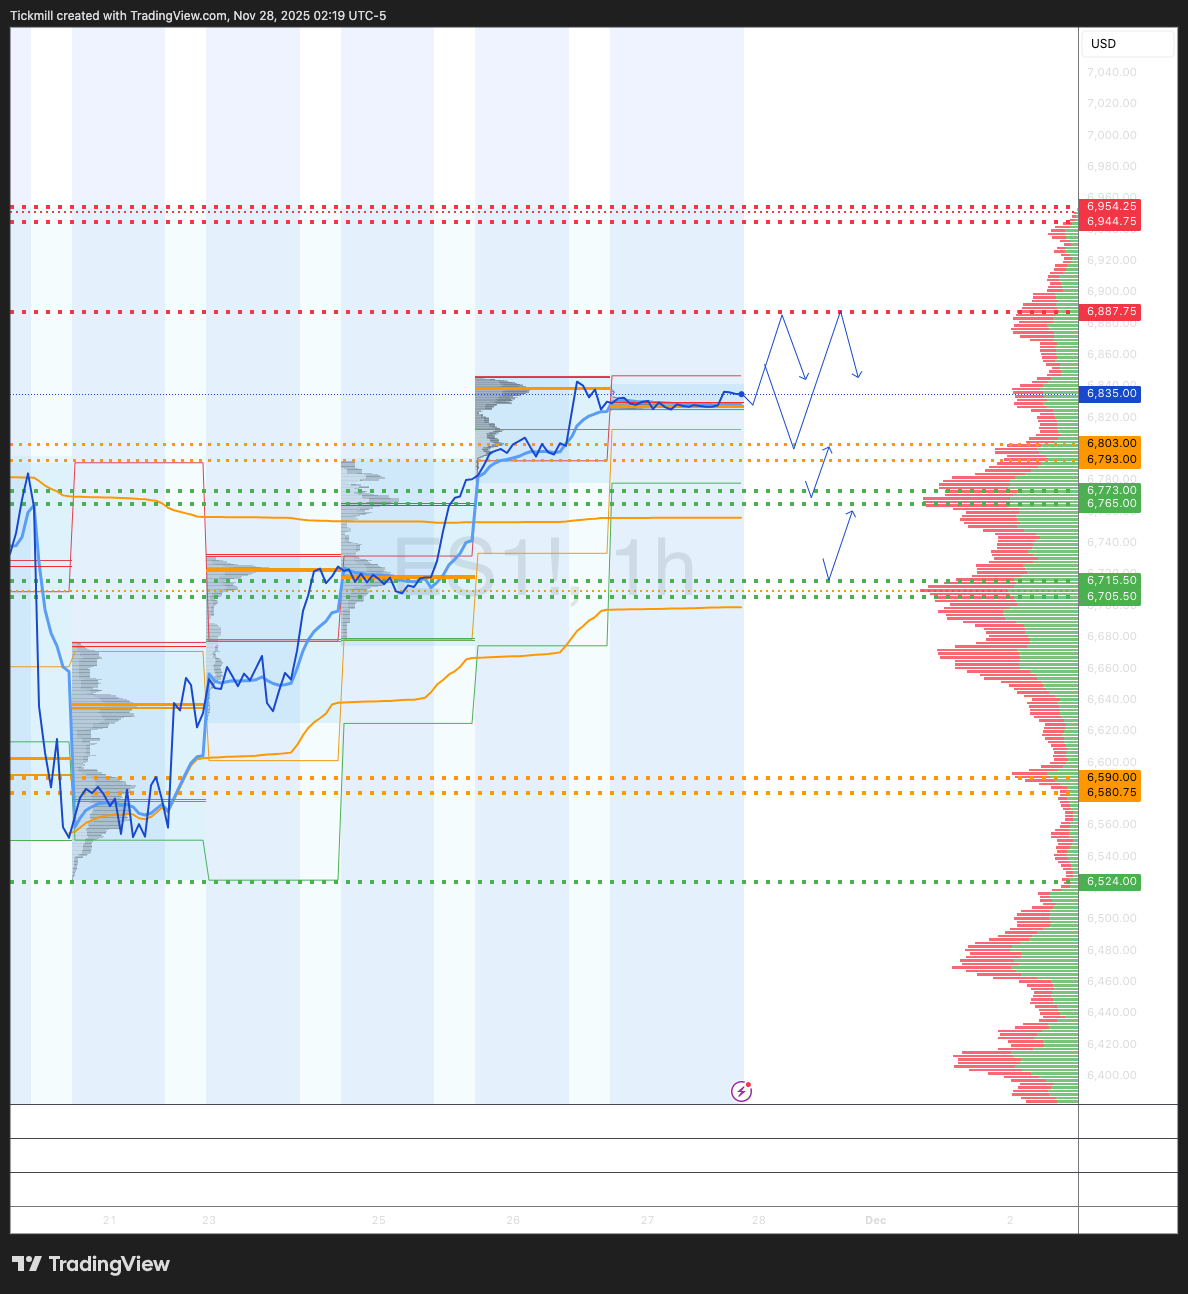
WEEKLY & DAILY LEVELS
***QUOTING ES1! FOR CASH US500 EQUIVALENT LEVELS, SUBTRACT POINT DIFFERENCE***
WEEKLY BULL BEAR ZONE 6590/80
WEEKLY RANGE RES 6765 SUP 6475
NOV EOM STRADDLE 7054/6626
DEC QOPEX STRADDLE 7025/6303
DAILY STRUCTURE – ONE TIME FRAMING HIGHER - 6795
DAILY BULL BEAR ZONE 6803/6793
DAILY RANGE RES 6887 SUP 6772
2 SIGMA RES 6944 SUP 6715
DAILY VWAP BULLISH 6720
VIX BULL BEAR ZONE 22.2
TRADES & TARGETS
LONG ON ON REJECT/RECLAIM DAILY BULL BEAR ZONE TARGET DAILY RANGE RES
SHORT ON TEST/REJECT DAILY RANGE RES TARGET DAILY BULL BEAR ZONE
(I FADE TESTS OF 2 SIGMA LEVELS ESPECIALLY INTO THE FINAL HOUR OF THE NY CASH SESSION AS 90% OF THE TIME WHEN TESTED THE MARKET WILL CLOSE ABOVE OR BELOW THESE LEVELS)
GOLDMAN SACHS TRADING DESK VIEWS
U.S. EQUITIES COLOR: A FACTOR SHOCK
November could conclude with an unchanged month for the S&P 500 – what a ride it’s been.
Since late October, the real story hasn’t been the S&P itself but rather the significant spike in factor volatility beneath the surface. The 20-day factor volatility has surged past 20, while S&P volatility has only edged up slightly. The stress is occurring within the market’s internals, not across the broader index.
The key takeaway: portfolios with concentrated “style” bets – whether focused on Growth and Momentum versus Value and Small-Cap, or AI winners versus broader sectors – have experienced much sharper swings compared to the overall market. For investors holding positions tilted toward specific themes or styles, the ride has been far bumpier than the broader market performance might suggest.
Crowding, particularly ahead of mega-cap tech earnings and the Fed’s announcements, was most evident in the options market within the Mag 7 complex. Across this group, put-call skew flipped to inverted territory (calls trading at a premium over puts), highlighting the extreme bullish positioning. However, over the past week, this has sharply reversed, bringing positioning back to more neutral levels.
As the month draws to a close, market breadth has shown signs of recovery. Earlier in November, the 5-day moving average of S&P advancers minus decliners had plunged to around -150, signaling significant underlying damage. Heading into Thanksgiving, that same metric has rebounded to the +150 range. This marks a notable shift, indicating broader market participation rather than a narrow rally, and suggests the market has worked through a considerable amount of mid-month stress.
Breadth has notably improved in recent days, as evidenced by the 5-day moving average of S&P advancers minus decliners returning to healthier levels.
Our Vol Panic Index reflects a similar trend. Currently at 5, it sits slightly above the 3-year average of 4.6 and remains below the 1-year average—significantly lower than the peaks observed earlier this month when market stress was more pronounced. The underlying components are noteworthy as well: implied volatility, volatility-of-volatility, term structure slope, and put–call skew have all eased collectively.
Systematic flows have also shifted in a more balanced direction. Over the past month, we estimate approximately $16 billion in S&P selling occurred, representing a substantial level of de-risking that contributed to the recent market correction. Looking forward, the baseline scenario for next month suggests moderate buying activity (+$4.7 billion). Additionally, the tail risk of forced systematic supply has significantly diminished.
Disclaimer: The material provided is for information purposes only and should not be considered as investment advice. The views, information, or opinions expressed in the text belong solely to the author, and not to the author’s employer, organization, committee or other group or individual or company.
Past performance is not indicative of future results.
High Risk Warning: CFDs are complex instruments and come with a high risk of losing money rapidly due to leverage. 69% and 73% of retail investor accounts lose money when trading CFDs with Tickmill UK Ltd and Tickmill Europe Ltd respectively. You should consider whether you understand how CFDs work and whether you can afford to take the high risk of losing your money.
Futures and Options: Trading futures and options on margin carries a high degree of risk and may result in losses exceeding your initial investment. These products are not suitable for all investors. Ensure you fully understand the risks and take appropriate care to manage your risk.
Patrick has been involved in the financial markets for well over a decade as a self-educated professional trader and money manager. Flitting between the roles of market commentator, analyst and mentor, Patrick has improved the technical skills and psychological stance of literally hundreds of traders – coaching them to become savvy market operators!