SP500 LDN TRADING UPDATE 5/12/25

SP500 LDN TRADING UPDATE 5/12/25
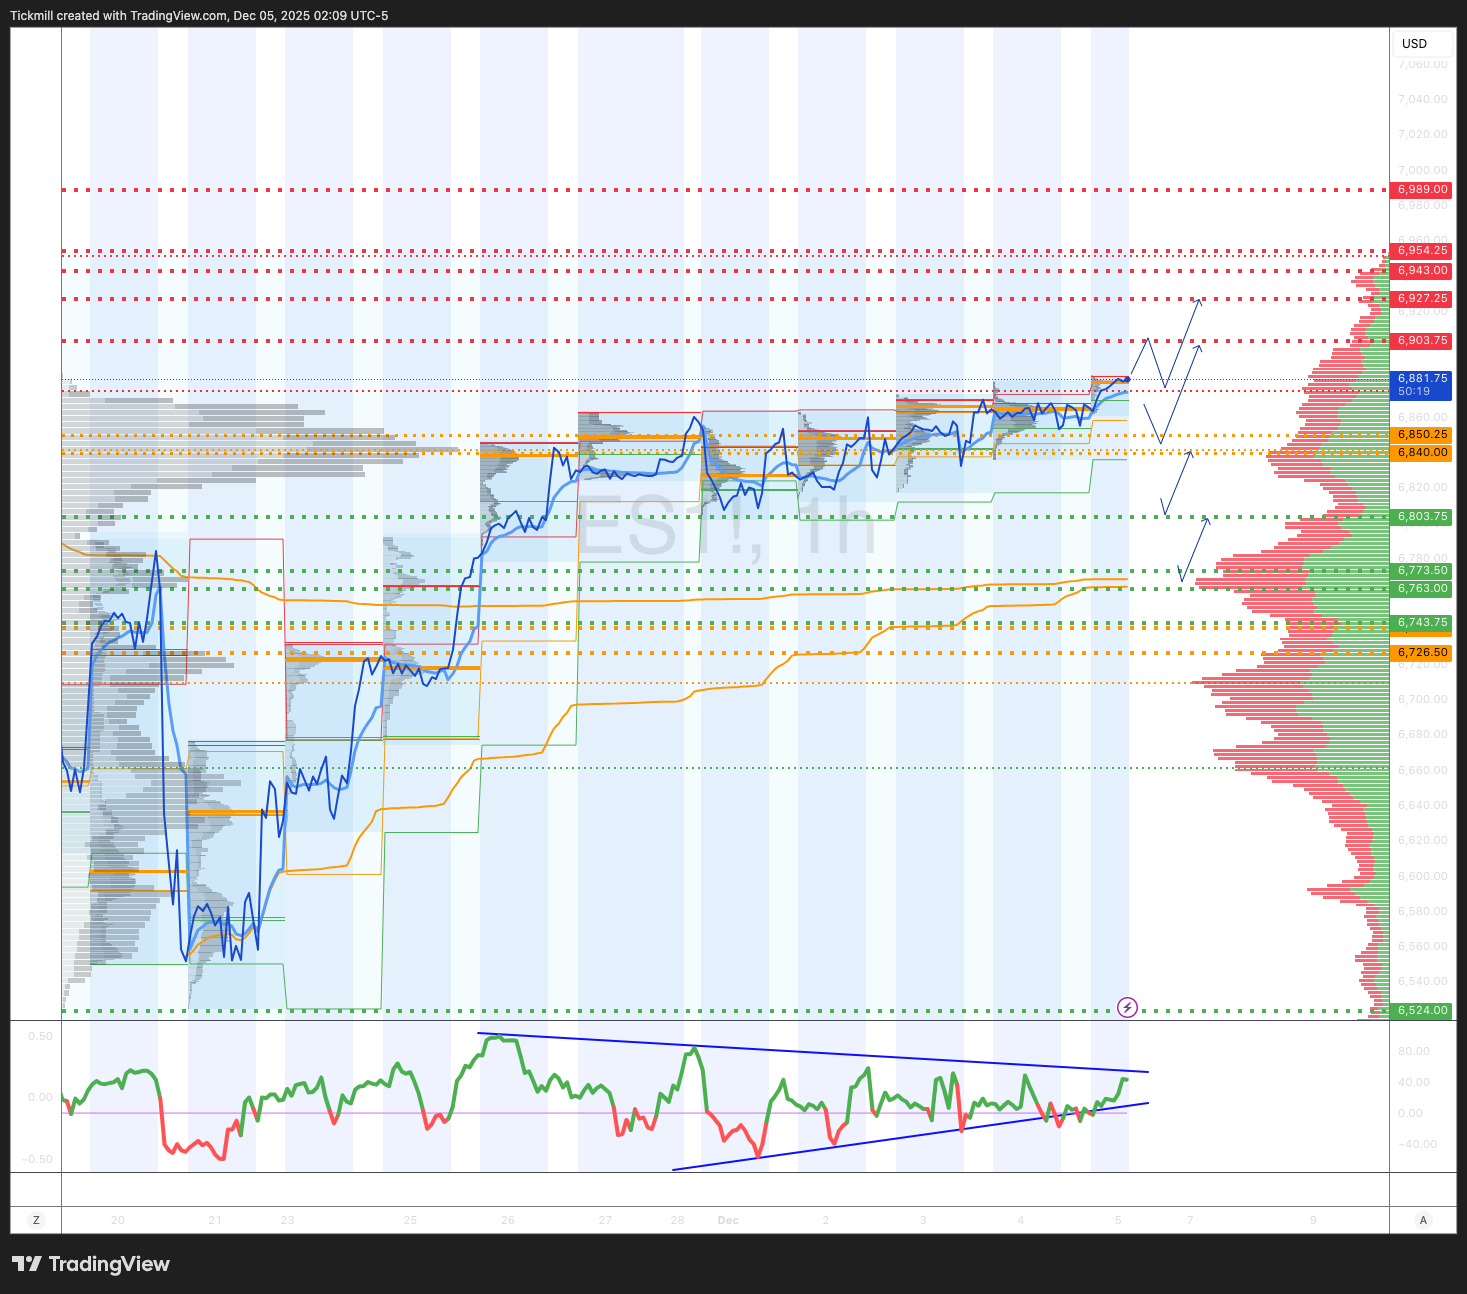
WEEKLY & DAILY LEVELS
***QUOTING ES1! FOR CASH US500 EQUIVALENT LEVELS, SUBTRACT POINT DIFFERENCE***
WEEKLY BULL BEAR ZONE 6740/26
WEEKLY RANGE RES 6943 SUP 6773
DEC EOM STRADDLE 6631/7067
DEC QOPEX STRADDLE 7025/6303
WEEKLY VWAP BULLISH 6726
MONTHLY VWAP BULLISH 6758
WEEKLY STRUCTURE – BALANCE - 6892/6539
MONTHLY STRUCTURE – BALANCE - 6952/6539
The SPX aggregate gamma flip point is at 6720, whereas we're currently close to the relative peak around 6850. This indicates that dealers typically support the price and will act to stabilise it as it fluctuates upward and downward.
DAILY STRUCTURE – ONE TIME FRAMING HIGHER - 6836
DAILY VWAP BULLISH 6848
DAILY BULL BEAR ZONE 6840/50
DAILY RANGE RES 6927 SUP 6803
2 SIGMA RES 6989 SUP 6743
VIX BULL BEAR ZONE 19.90
PUT/CALL RATIO 1.11 ⇩
TRADES & TARGETS
LONG ON ON REJECT/RECLAIM DAILY BULL BEAR ZONE TARGET DAILY RANGE RES
SHORT ON TEST/REJECT DAILY RANGE RES TARGET DAILY BULL BEAR ZONE
LONG ON TEST/REJECT DAILY RANGE SUP TARGET DAILY BULL BEAR ZONE
(I FADE TESTS OF 2 SIGMA LEVELS ESPECIALLY INTO THE FINAL HOUR OF THE NY CASH SESSION AS 90% OF THE TIME WHEN TESTED THE MARKET WILL CLOSE ABOVE OR BELOW THESE LEVELS)
GOLDMAN SACHS TRADING DESK VIEW
SPX Daily Implied Moves: Decline in Volatility Expectations
Over the past two weeks, SPX options prices have fallen across the curve, reflecting a significant decline in volatility expectations. Professional investors have reduced their positioning, aligning with broader trends in risk assets. Over the past month, volatility in equity markets has mirrored fluctuations in expectations for Fed rate cuts, highlighting the critical influence of Fed policy on equity options market.
Looking back to last year, the December 2024 Fed meeting marked a pivotal moment for institutional positioning. On December 18, 2024, the Fed’s clear signal to pause rate cuts prompted global macro investors to scale back their equity futures positions. This decline in equity demand was evident in the 6-12-month S&P futures funding spreads (illustrated by the light blue line below). Recognizing this shift in institutional positioning as a leading indicator, we adopted a cautious stance at the beginning of 2025.
However, after the spike in put-call skew on April 5, 2025, we returned to a neutral position, and the subsequent increase on April 10, 2025, led us to adopt a bullish outlook on equity asymmetry. As the December 10, 2025, FOMC announcement approaches, we are carefully monitoring funding spreads to gauge the positioning of global macro investors in futures, swaps, and options.
The recent one-month decline in funding spreads indicates that global macro investors have been reducing their equity exposure, even as the SPX rebounded to near all-time highs. Based on this alone, we anticipate only a statistically insignificant decline in the SPX over the next three months. We will continue to monitor institutional positioning closely as monetary policy expectations take center stage in the coming weeks. To clarify, our analysis does not predict specific FOMC actions but instead focuses on positioning in this derivatives market as a leading indicator for broader trends.
Single Stock Options Volumes Decline; Hedge Funds Likely to Increase Short Positions
Single stock options volumes have decreased recently, which could embolden hedge funds to increase short positions in stocks with weak fundamentals. When single stock options volumes are high, hedge funds are typically cautious about shorting stocks due to the risk of a gamma squeeze driving asymmetric upside. However, the recent decline in options volumes (partly due to the typically low activity during Thanksgiving week) reduces the influence of options positioning on stock price movements.
We believe this environment encourages hedge funds to add more shorts in fundamentally weak stocks. Over the coming days, we will closely monitor single stock options volumes to determine whether this trend extends beyond the usual holiday lull.
Disclaimer: The material provided is for information purposes only and should not be considered as investment advice. The views, information, or opinions expressed in the text belong solely to the author, and not to the author’s employer, organization, committee or other group or individual or company.
Past performance is not indicative of future results.
High Risk Warning: CFDs are complex instruments and come with a high risk of losing money rapidly due to leverage. 69% and 73% of retail investor accounts lose money when trading CFDs with Tickmill UK Ltd and Tickmill Europe Ltd respectively. You should consider whether you understand how CFDs work and whether you can afford to take the high risk of losing your money.
Futures and Options: Trading futures and options on margin carries a high degree of risk and may result in losses exceeding your initial investment. These products are not suitable for all investors. Ensure you fully understand the risks and take appropriate care to manage your risk.
Patrick has been involved in the financial markets for well over a decade as a self-educated professional trader and money manager. Flitting between the roles of market commentator, analyst and mentor, Patrick has improved the technical skills and psychological stance of literally hundreds of traders – coaching them to become savvy market operators!