SP500 LDN TRADING UPDATE 29/9/25
.jpg)
SP500 LDN TRADING UPDATE 29/9/25
***QUOTING ES1 CONTRACT FOR CASH US500 EQUIVALENT LEVELS SUBTRACT ~60 POINTS***
***WEEKLY ACTION AREA VIDEO TO FOLLOW AHEAD OF NY OPEN***
WEEKLY BULL BEAR ZONE 6670/60
WEEKLY RANGE RES 6720 SUP 6567
SEP EOM STRADDLE 178 POINTS - 6282/6638
OCT MOPEX 6842/6487
DEC QOPEX 6303/7025
DAILY VWAP BULLISH 6689
WEEKLY VWAP BULLISH 6630
DAILY BALANCE 6756/6611
WEEKLY ONE TIME FRAMING HIGHER - 6624
MONTHLY ONE TIME FRAMING UP - 6239
Balance: This refers to a market condition where prices move within a defined range, reflecting uncertainty as participants await further market-generated information. Our approach to balance includes favoring fade trades at the range extremes (highs/lows) while preparing for potential breakout scenarios if the balance shifts.
One-Time Framing Up (OTFU): This represents a market trend where each successive bar forms a higher low, signaling a strong and consistent upward movement.
One-Time Framing Down (OTFD): This describes a market trend where each successive bar forms a lower high, indicating a pronounced and steady downward movement.
GOLDMAN SACHS TRADING DESK VIEWS
### NETS CUT THE MOST SINCE LIBERATION WEEK
FICC and Equities
28 September 2025
“Knowing others is intelligence; knowing yourself is true wisdom.” — Laozi
We are receiving considerable pushback from traders as we continue to emphasize that institutional investor positioning remains relatively light while broader indices hover near all-time highs. This pushback likely indicates that upside risk at the index level into year-end still exists. Our quarter-end pension rebalance estimate currently suggests $19 billion of U.S. equities for sale. This figure ranks in the 89th percentile among all buy and sell estimates in absolute dollar value over the past three years and also in the 89th percentile going back to January 2000.
Once this headwind is removed (after the calendar flips to October), I anticipate watching the S&P 500 continue its march toward 7,000 in relatively short order.
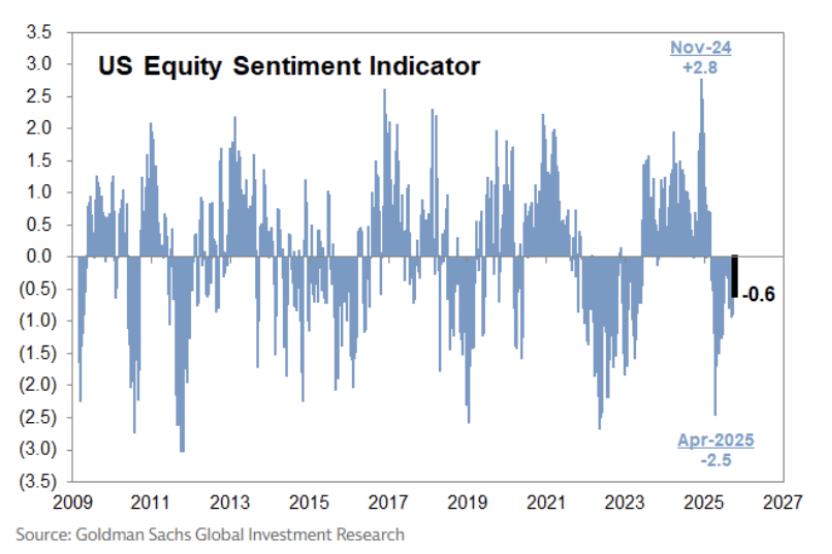
Regarding light positioning, our sentiment indicator registered its 30th consecutive negative reading last week, coming in at -0.6. None of the nine positioning measures in our indicator are in "stretched" territory. This marks the third-longest streak of consecutive negative readings in the history of our dataset, which dates back to 2015. There have been two previous streaks of 32 weeks of negative readings.
### Hedge Funds Reduce Risk Significantly
Hedge funds (HFs) cut a substantial amount of risk last week, with U.S. Fundamental Long/Short (L/S) gross leverage falling for the first time in four weeks, decreasing by 1.2 points to 214.6%.
Last week’s notional U.S. de-grossing—comprising short covers and long sales combined—was the largest since July 2024 and ranks in the 98th percentile compared to the past five years.
Additionally, U.S. Fundamental L/S net leverage decreased by 2.5 points, marking the largest weekly decrease since Liberation Day, bringing it down to 50.7% (28th percentile year-to-date).
This reduction in leverage indicates a cautious approach among hedge funds amid current market conditions.
Disclaimer: The material provided is for information purposes only and should not be considered as investment advice. The views, information, or opinions expressed in the text belong solely to the author, and not to the author’s employer, organization, committee or other group or individual or company.
Past performance is not indicative of future results.
High Risk Warning: CFDs are complex instruments and come with a high risk of losing money rapidly due to leverage. 69% and 73% of retail investor accounts lose money when trading CFDs with Tickmill UK Ltd and Tickmill Europe Ltd respectively. You should consider whether you understand how CFDs work and whether you can afford to take the high risk of losing your money.
Futures and Options: Trading futures and options on margin carries a high degree of risk and may result in losses exceeding your initial investment. These products are not suitable for all investors. Ensure you fully understand the risks and take appropriate care to manage your risk.
Patrick has been involved in the financial markets for well over a decade as a self-educated professional trader and money manager. Flitting between the roles of market commentator, analyst and mentor, Patrick has improved the technical skills and psychological stance of literally hundreds of traders – coaching them to become savvy market operators!