S&P500 Daily Action Areas & Price Targets 1/6/26

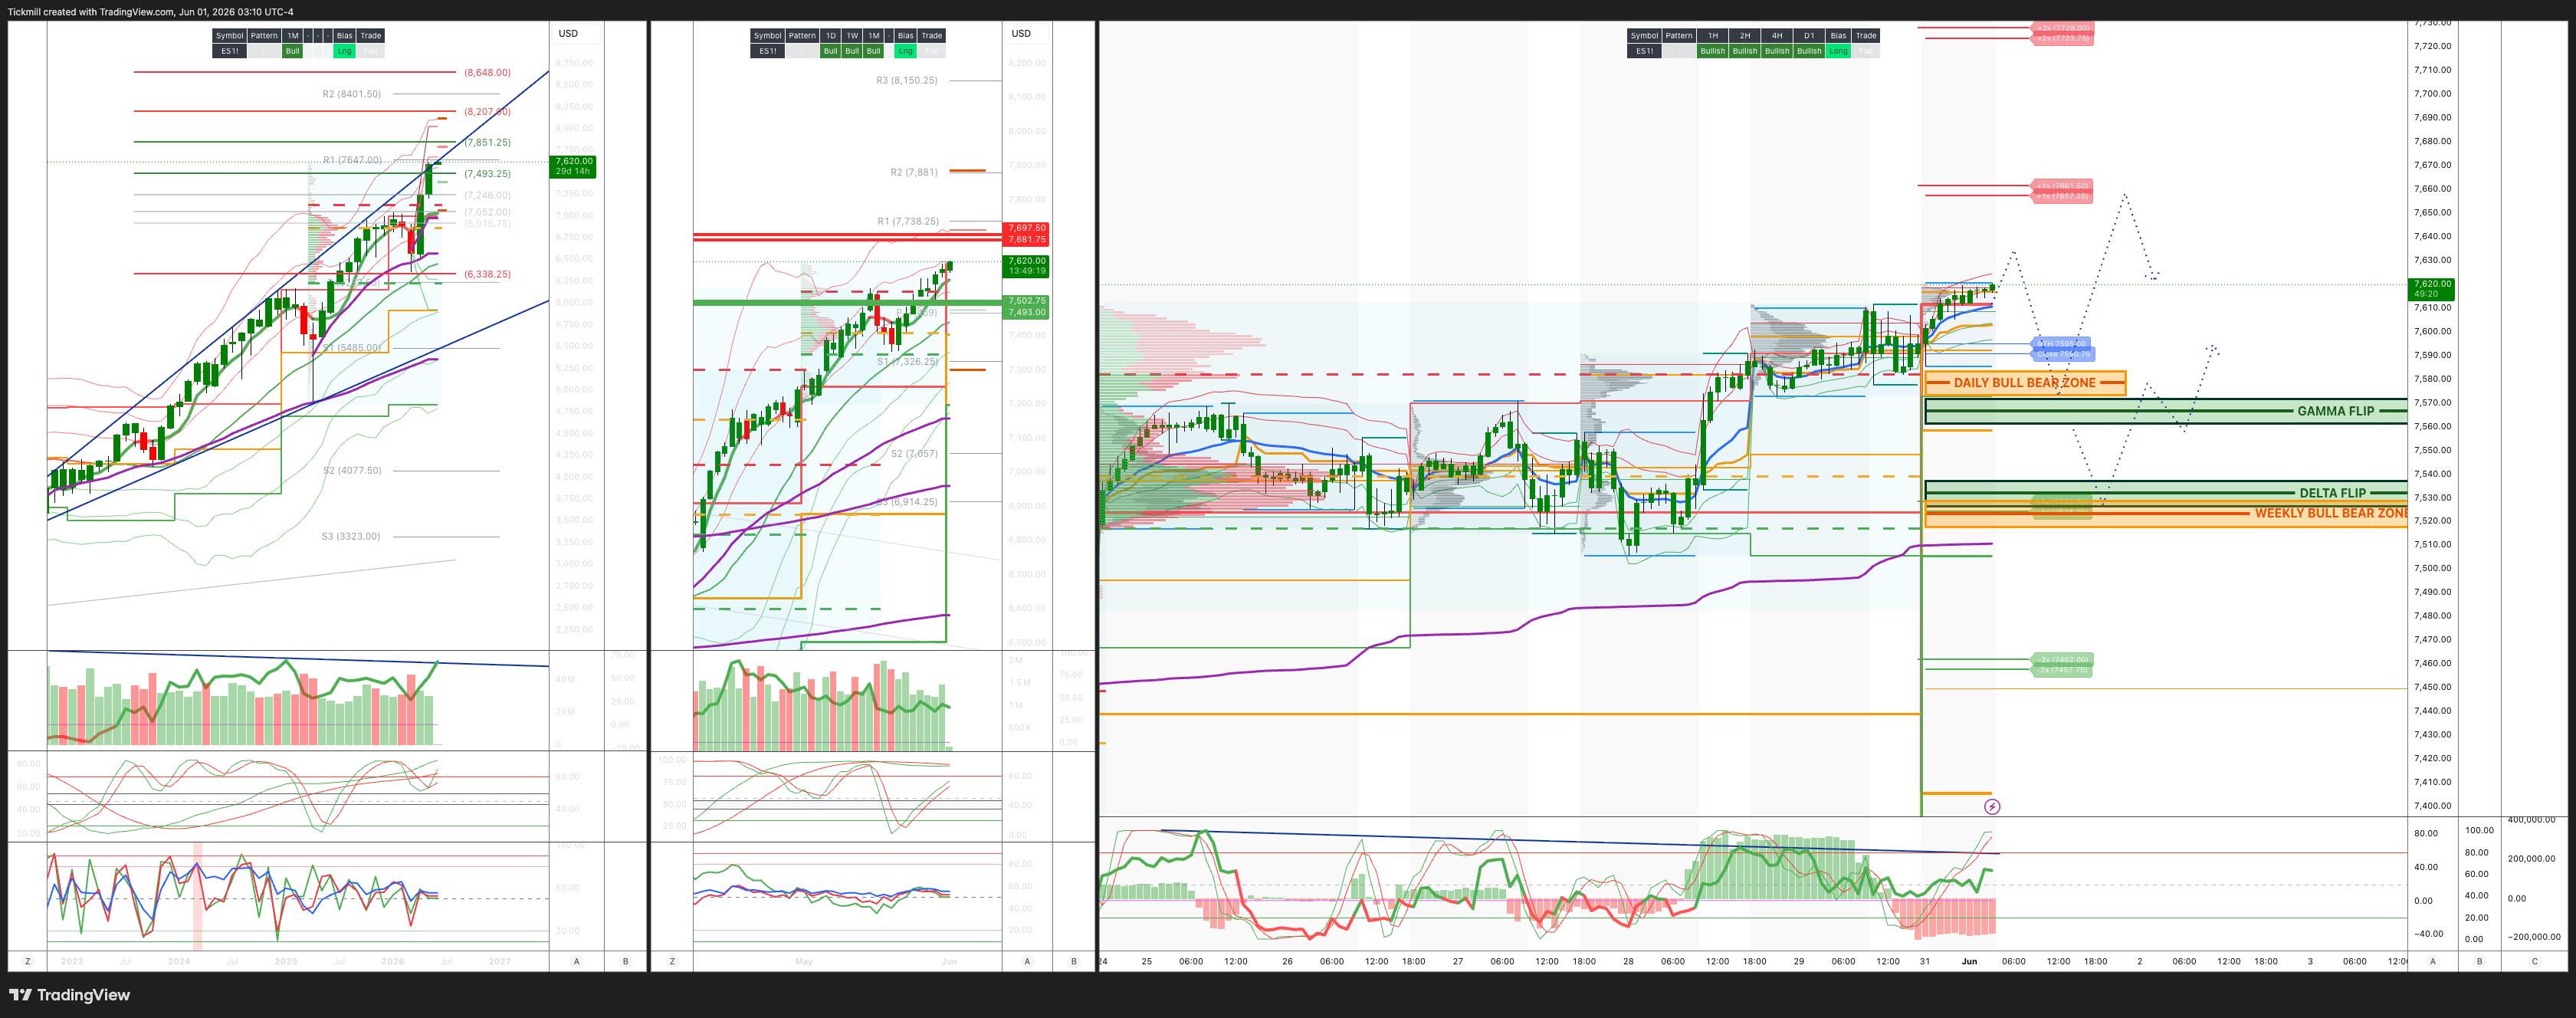
S&P500 Daily Action Areas & Price Targets 1/6/26
***QUOTING ES1! FOR CASH US500 EQUIVALENT LEVELS, SUBTRACT POINT DIFFERENCE***
WEEKLY BULL BEAR ZONE 7535/25
WEEKLY RANGE RES 7680 SUP 7500
June MOPEX Straddle: 274pt range implies a OPEX to OPEX range of [7134, 7683]
June QOPEX Straddle is 546.4pt giving us a range of [5960,7052]
JHEQX Q2 Collar 6189/6290 - 6865/6955
DEC2025 OPEX to DEC2026 OPEX is 945 points giving us a range of [5889,7779]
SPX PUT/CALL RATIO 0.88 (The numbers reflect options traded during the current session. A put-call ratio below 0.7 is generally considered bullish, and a put-call ratio above 1.0 is generally considered bearish)
DAILY VWAP BULLISH 7585
WEEKLY VWAP BULLISH 7480
MONTHLY VWAP BULLISH 7036
DAILY STRUCTURE - OTFH 7577
WEEKLY STRUCTURE – OTFH - 7515
MONTHLY STRUCTURE - OTFH - 7199
Balance: This refers to a market condition where prices move within a defined range, reflecting uncertainty as participants await further market-generated information. Our approach to balance includes favouring fade trades at the range extremes (highs/lows) while preparing for potential breakout scenarios if the balance shifts.
One-Time Framing Higher (OTFH): This represents a market trend where each successive bar forms a higher low, signalling a strong and consistent upward movement.
One-Time Framing Lower (OTFL): This describes a market trend where each successive bar forms a lower high, indicating a pronounced and steady downward movement.
DAILY BULL BEAR ZONE 7585/75
GAMMA FLIP 7544
DELTA FLIP 7495
DAILY RANGE RES 7606 SUP 7488
2 SIGMA RES 7606 SUP 7407
VIX BULL BEAR ZONE 19
TRADES & TARGETS
LONG ON REJECT/RECLAIM DAILY BULL BEAR ZONE TARGET DAILY RANGE RES
***ADDITIONAL SETUPS & TARGETS HIGHLIGHTED ON THE CHARTS***
(I FADE TESTS OF 2 SIGMA LEVELS ESPECIALLY INTO THE FINAL HOUR OF THE NY CASH SESSION AS 90% OF THE TIME WHEN TESTED THE MARKET WILL CLOSE ABOVE OR BELOW THESE LEVELS)
GOLDMAN SACHS TRADING DESK VIEW - ‘Colour On The Week’
US equities closed out the week and month with explosive volumes, helped by the MSCI quarterly rebalance. The S&P 500 finished slightly higher on Friday, taking the index to roughly a 1.5% gain for the week and another 5%+ gain for May. The Nasdaq 100 ended May up roughly 10%, marking two consecutive months of double-digit gains for the first time since 2009, and is now approximately 32% above the March lows. The index tape remains constructive, but the flow and factor picture is much more nuanced. Asset manager and hedge fund flow skews finished roughly flat on the week despite large moves and growing dispersion across Tech and the broader market. Institutional activity felt quiet relative to the scale of price action, suggesting that other flow drivers, likely retail, quant, index/rebalance activity, and systematic flows, played an important role.
Goldman Prime data show hedge funds net bought US equities for a second straight week and at the fastest pace in six months. The buying was driven by long buys and short covers in Macro Products, while Single Stocks saw de-grossing activity for the first time in five weeks. That distinction matters. Hedge funds appear to be increasing market-level exposure while reducing some single-name gross exposure, consistent with a market where broad beta and index exposure are being re-added but individual stock dispersion is making single-name risk harder to manage. Financials were the most net-bought sector this week, driven by long buys. Industrials were net sold for a second straight week, have now been net sold in seven of the last eight weeks, and are tracking to be net sold for a fourth straight month. US L/S gross leverage rose 0.2 points to 210.4%, the 20th percentile over one year, while US L/S net leverage rose 1.5 points to 55.3%, the 89th percentile over one year. The important point is that net exposure is high while gross is not. Hedge funds are directionally long, but not running especially high gross exposure in US L/S books, which can make the market more sensitive to beta shocks while also suggesting managers still have room to add single-name gross if confidence improves.
The S&P 500 implied move through next Friday, June 5, is 1.2%. With the S&P around 7,564, that implies a move of about 91 points and a rough options-implied range of 7,473 to 7,655. The event calendar is macro-heavy, with US ISM Manufacturing on Monday, JOLTS on Tuesday, ISM Services on Wednesday, and nonfarm payrolls on Friday. The macro focus will be on whether the data validate the recent growth/risk-on broadening without reigniting rates pressure. The best outcome for equities is probably “good enough growth, not too hot inflation/wages.” A softer but non-recessionary labor market would likely support software, duration growth, and equal-weight participation. A hot employment report could put yields back in focus and challenge the crowded parts of Tech.
The micro calendar is also busy, especially across Consumer and TMT. Consumer earnings include DG on Tuesday, OLLI and FIVE on Wednesday, and BFB and LULU on Thursday. TMT earnings include HPE on Monday, PANW on Tuesday, and AVGO and CRWD on Wednesday. The conference calendar is equally important, with Computex in Taipei running Monday through Friday, alongside NVDA GTC Taipei, Cisco Live, Snowflake Summit, Microsoft Build, and NAREIT. This creates a dense catalyst window for AI infrastructure, software, networking, cloud, cybersecurity, and real estate.
TMT remains the center of the market. The Nasdaq 100 closed May up roughly 10%, delivering two consecutive months of double-digit gains for the first time since 2009. The index is now approximately 32% above the March lows. But the factor action beneath the surface is extremely volatile. The GS TMT Momentum pair fell about 1,020bps on Friday, its second-worst day in recent history. Year-to-date, there have already been more than 25 daily moves of plus or minus 5% in the GS TMT Momentum pair, compared with just six in all of 2025. That tells us the market is not simply “risk on.” It is risk on with violent rotation. The most important sector move is software, which rose about 8% this past week, supported by positioning tailwinds, better-than-feared results, especially OKTA and SNOW, and a narrative rate-of-change improvement as the AI trade broadened beyond semis and hardware. The desk continues to watch for dispersion within software, with data infrastructure and security preferred over more generic SaaS. The coming week’s Computex, NVDA GTC Taipei, Cisco Live, Snowflake Summit, and Microsoft Build events could shape the next phase of the AI narrative.
Energy equities underperformed as the broader market continued to price in Middle East de-escalation and potential peace. This is despite macro data still screening positively, with US demand healthy, inventories low, near-term supply tight, and dedicated energy investor sentiment still broadly constructive. The desk saw more inbound interest around the oilfield services pullback, including HAL, SLB, WFRD, and PTEN, with the key debate being whether the North America versus international trade can still work. There was also renewed interest in pipelines for the first time in several weeks, helped by EIC commentary around bullish Permian exit-to-exit volume growth in 2026/2027 and improving EPS revision trends. Energy is being punished by geopolitical relief and lower crude, but fundamentals have not collapsed. The group may increasingly divide between oil beta losers and infrastructure or pipeline names with improving volume and earnings visibility.
Industrials fell about 120bps in May, while Materials declined around 20bps, both meaningfully underperforming the broader market, which remained supported by Tech. Transports were the standout within Industrials. The Montgomery Supreme Court verdict sparked excitement around further supply-side tightness, driving trucking names up roughly 15-20% in May, although the benefit remains debated. Housing-related names lagged as inflation concerns and higher rates weighed on sentiment during the month. The most topical names included PH, DE, KNX, F, SHW, MLM, HON, and FDX. Key items to watch next month include ISM, truck orders, auto sales, FAST ADS, HON and JCI analyst days, and final conference commentary before Q2 earnings blackout. Aerospace aftermarket trends remain worth monitoring, with data points from GE AGM, HEI earnings, and sell-side checks continuing to point to strength. However, bearishness is building as Boeing and Airbus ramp production while airlines announce meaningful capacity cuts. Industrials remain out of favor, but there are idiosyncratic opportunities, with transports the clearest inflection, housing-linked names still rate-sensitive, and aerospace becoming more debated.
Consumer sentiment has softened at the start of Q2 due to fading tax-refund tailwinds, rising gas price concerns, freight headwinds, and cautious company commentary. Recent caution came from names such as MCD, SHAK, PLNT, COST, and AZO. The commentary has not been disastrous, but it has been enough to weigh materially on the group. Investors remain glass-half-empty on Consumer despite some companies still describing a solid start to Q2. The positive development is rising interest in housing-related consumer names, with multiple long-term buyers showing up across the complex. Consumer remains highly selective. Lower oil helps, but investors are still skeptical, and the group remains earnings-sensitive.
Financials modestly underperformed the S&P 500 on a headline basis, but internal dispersion was significant. Fintech was the standout, up high-single digits, led by higher short-interest stocks. The rally was supported by growing optimism around an inflection in retail trading, benefiting names such as HOOD, IBKR, and SOFI. Dispersion also appeared in subsectors exposed to perceived or debated AI risk. Information services participated in the software rally, while insurance brokers, CRE brokers, and wealth management declined by low-to-mid single digits. For insurance brokers and CRE brokers, the frustration among bulls is that there were no new developments to reduce AI disruption concerns. In wealth and retail brokers, the debate centered around monetization of customer cash after Robinhood announced Agentic Equities Trading, which resurfaced concerns about cash optimization and the broader role of financial advisors. Next week, NAREIT is the key real estate event, with the main focus on whether strong leasing momentum from Q1 continued into Q2 and beyond.
The main takeaway is that the rally is broadening, but not calming down. The S&P finished May up more than 5%, and the Nasdaq 100 rose about 10%, but extreme factor moves show the market is becoming more rotational rather than more stable. Hedge funds are adding beta through macro products, but single-stock de-grossing points to caution around idiosyncratic volatility. Software has become the key broadening test. If software can continue to build on SNOW, OKTA, MDB, and the coming catalyst calendar, the AI trade can broaden in a healthier way beyond semis. If it fails, the market may revert to a more concentrated leadership structure. With the S&P implied move at 1.2% through Friday and a packed macro calendar ahead, the next test is whether the market can absorb data risk while maintaining the rotation into software, fintech, select consumer, and other laggard pockets.
Disclaimer: The material provided is for information purposes only and should not be considered as investment advice. The views, information, or opinions expressed in the text belong solely to the author, and not to the author’s employer, organization, committee or other group or individual or company.
Past performance is not indicative of future results.
High Risk Warning: CFDs are complex instruments and come with a high risk of losing money rapidly due to leverage. 69% and 73% of retail investor accounts lose money when trading CFDs with Tickmill UK Ltd and Tickmill Europe Ltd respectively. You should consider whether you understand how CFDs work and whether you can afford to take the high risk of losing your money.
Futures and Options: Trading futures and options on margin carries a high degree of risk and may result in losses exceeding your initial investment. These products are not suitable for all investors. Ensure you fully understand the risks and take appropriate care to manage your risk.
Patrick has been involved in the financial markets for well over a decade as a self-educated professional trader and money manager. Flitting between the roles of market commentator, analyst and mentor, Patrick has improved the technical skills and psychological stance of literally hundreds of traders – coaching them to become savvy market operators!